BASIC POPULATION MODEL
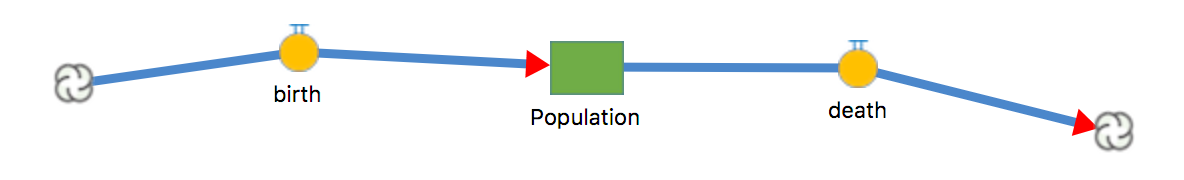
We will begin our Model Library series with a Basic Population Model, in which some population will grow over time. In this model, we shall use a STATE to represent
the number of individuals at any given time, and two FLOWS to represent the changes that occur in that STATE: one for births, and one for deaths. We will use a few
terms to describe the rates of births and deaths in these populations, all of which shall be explained along the way.
- Open the component palette by clicking on
 the toolbar.
 - Now, let us begin by adding a Population STATE to the canvas:
- Click the STATE icon
 on the component palette.
 - Drag the STATE icon onto the platform, which we will call our canvas.
- Enter in 'Population' for the stock name.
- Click the STATE icon
- Next, add a births FLOW to your canvas:
- Click on the FLOW icon
 on the component palette (the blue color will appear once you select the component).
 - Enter in 'births' for the flow name.
- Click on the FLOW icon
- Grab the cloud symbol at the hollow end of the FLOW and drag it on top of the STATE until it 'sticks'.
- Next, add a deaths FLOW to the canvas:
- Click on the FLOW icon again on the components palette.
- Enter in 'deaths' for the FLOW name.
- Grab the cloud symbol at the solid end of the flow and drag it on top of the stock until it 'sticks'. You model should now look like
- Create a TERM to hold the Initial Population (initial_pop) value for the Population:
- Click the TERM
 icon on the component palette.
 - Drag the TERM icon below the Population STATE. Label it 'initial_pop'.
- Then, double-click on initial_pop and on the right side, you should see a white box and the title "Value." Enter 1.0 in the Value box.
- Click the TERM
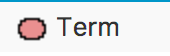
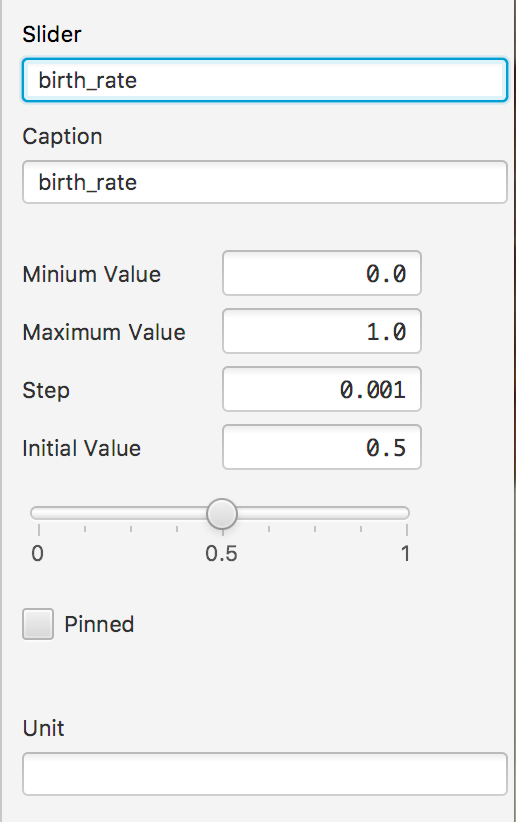
- Now, below the Components section, you should see Displays & Controls. Select the SLIDER icon, and drag one above births and one above deaths.
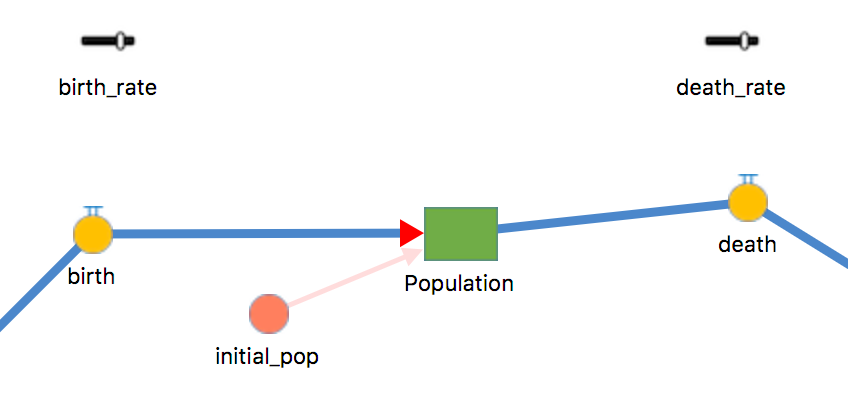
- Label them as birth_rate and death_rate, as shown here:
- Double click on birth_rate. Here are some arbitrary values we can add for now:
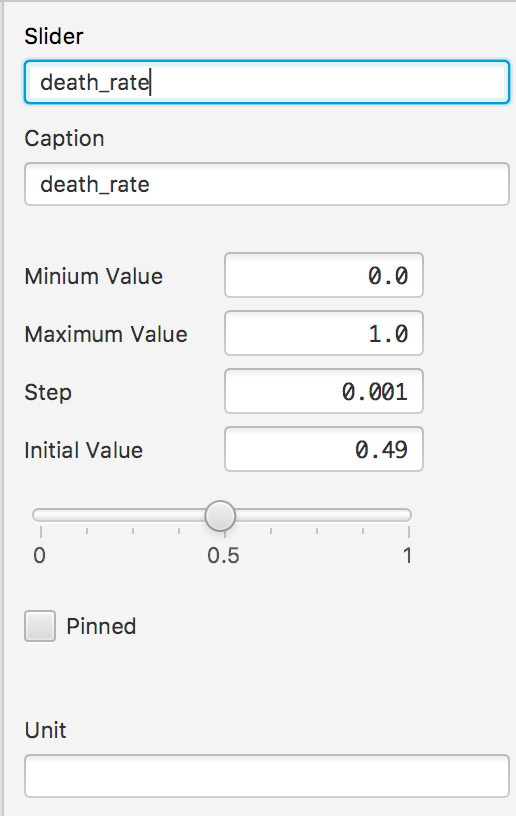
And for death_rate:
- Label them as birth_rate and death_rate, as shown here:
- Now, we want to set Births = Population * birth_rate. But before we can do this, we need to connect both birth_rate and Population to Births, because births is dependent on the birth_rate and Population components.
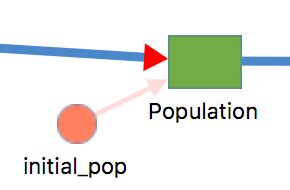
- So, double click on your Population STATE. In the "Init" section, enter "initial_pop". An arrow should appear, going from your Initial Population to the Population itself, as shown to the right.
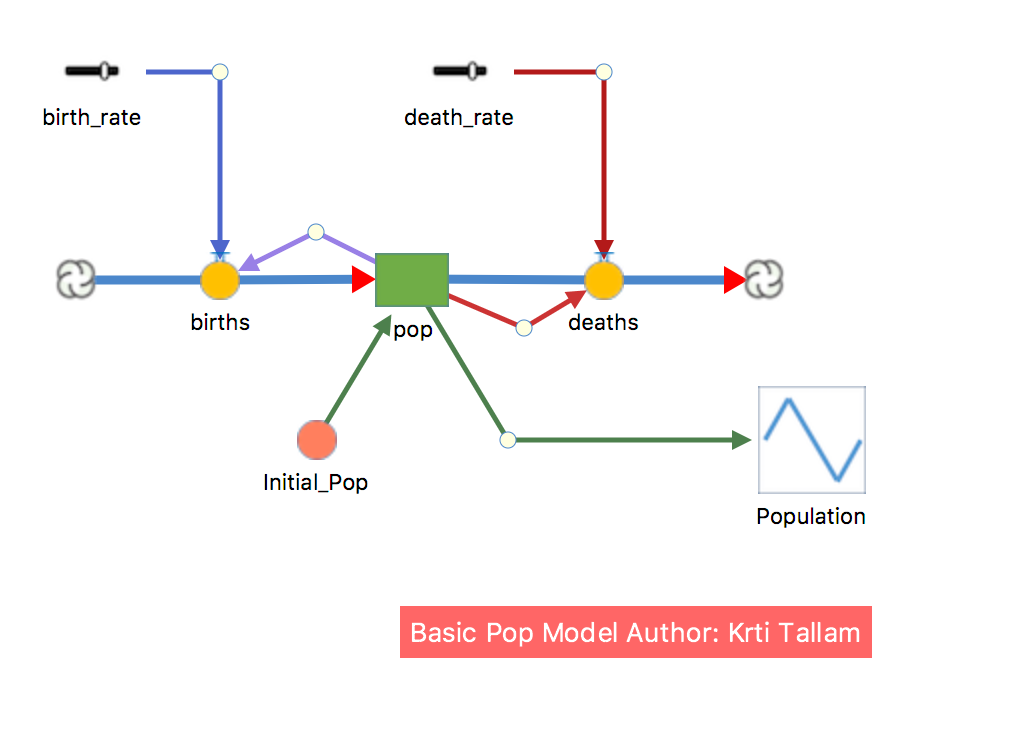
- Click on birth and in the white box under Value, enter Population * birth_rate. There should now be a light-pink arrow connecting birth_rate to birth. Now click on death and under Value, enter Population * death_rate. There should now be a light-pink arrow connecting death_rate to death. At this point, your model should look similar to the following diagram:
- Now we need to set initial conditions for your population stock. In other words, we must decide how many individuals are in this population at the beginning of the model, before it is run. For the sake of this model, let us begin with 50 individuals.
- Double-click on initial_pop. The reason this term is circular and salmon-colored is because it represents a CONSTANT value. Hence, we type in 50. That is, 50 individuals, and that value remains the same.
Now, your model is almost ready to run! There is one last step we must conduct, in order to view our output.
- We must add a graph, so that we can observe how our population change over time. Again, below the Components section, you should see Displays & Controls. Select the LINEGRAPH icon.
- Drag the graph onto your canvas, to the right of the Population STATE.
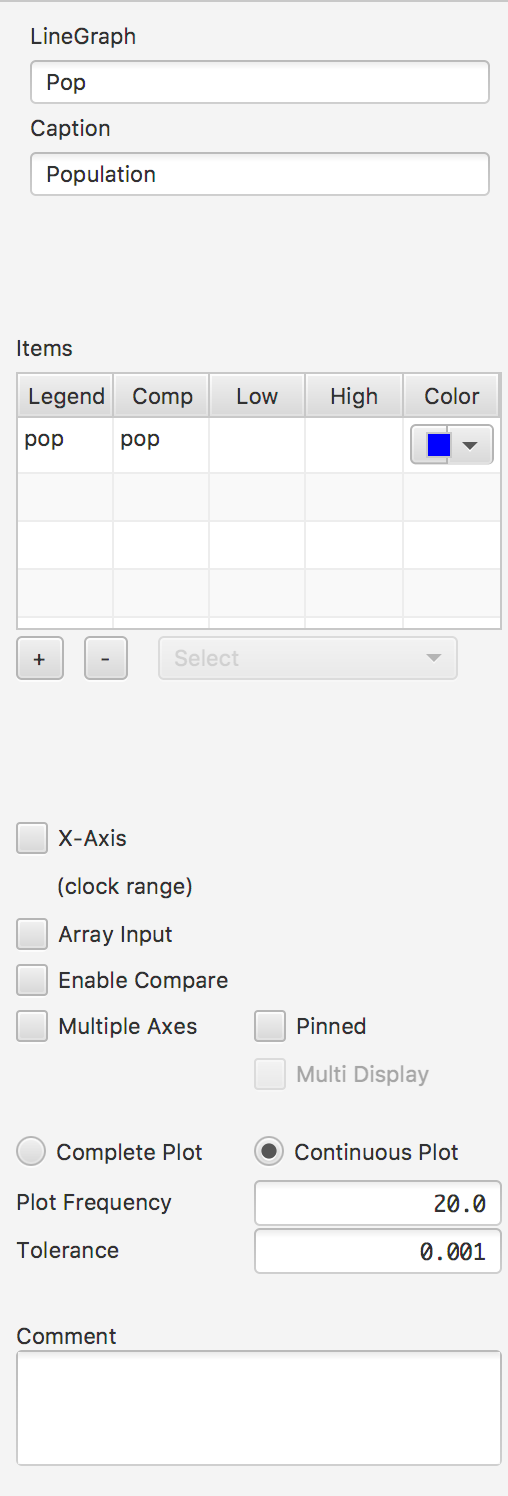
- Enter Pop into the graph name, and Population underneath the white space for Caption. The Pop name is to ensure that we do not have the same name as our Population STATE. The Caption does not affect the names that appear on the canvas.
- You'll notice that in addition to the icon for the graph on the model canvas, a graph display appears on the Dashboard. Double click on the graph to set the graph properties.
- Locate the Items box. You will see a "+" arrow. Select that, and then click on the "Select dropdown." Now, select Population.
- In the Plot Frequency, type in 20.0; in the Tolerance, enter 0.001. These values can be adjusted to your model at any time.
- At this point, your settings should appear similar to the following:
- Now, if you press Launch in the upper left side of the screen, Numerus will open a new page where you can view the results of your model, either as a Graph or as a Table. The following is an example of how you can play around with the settings.
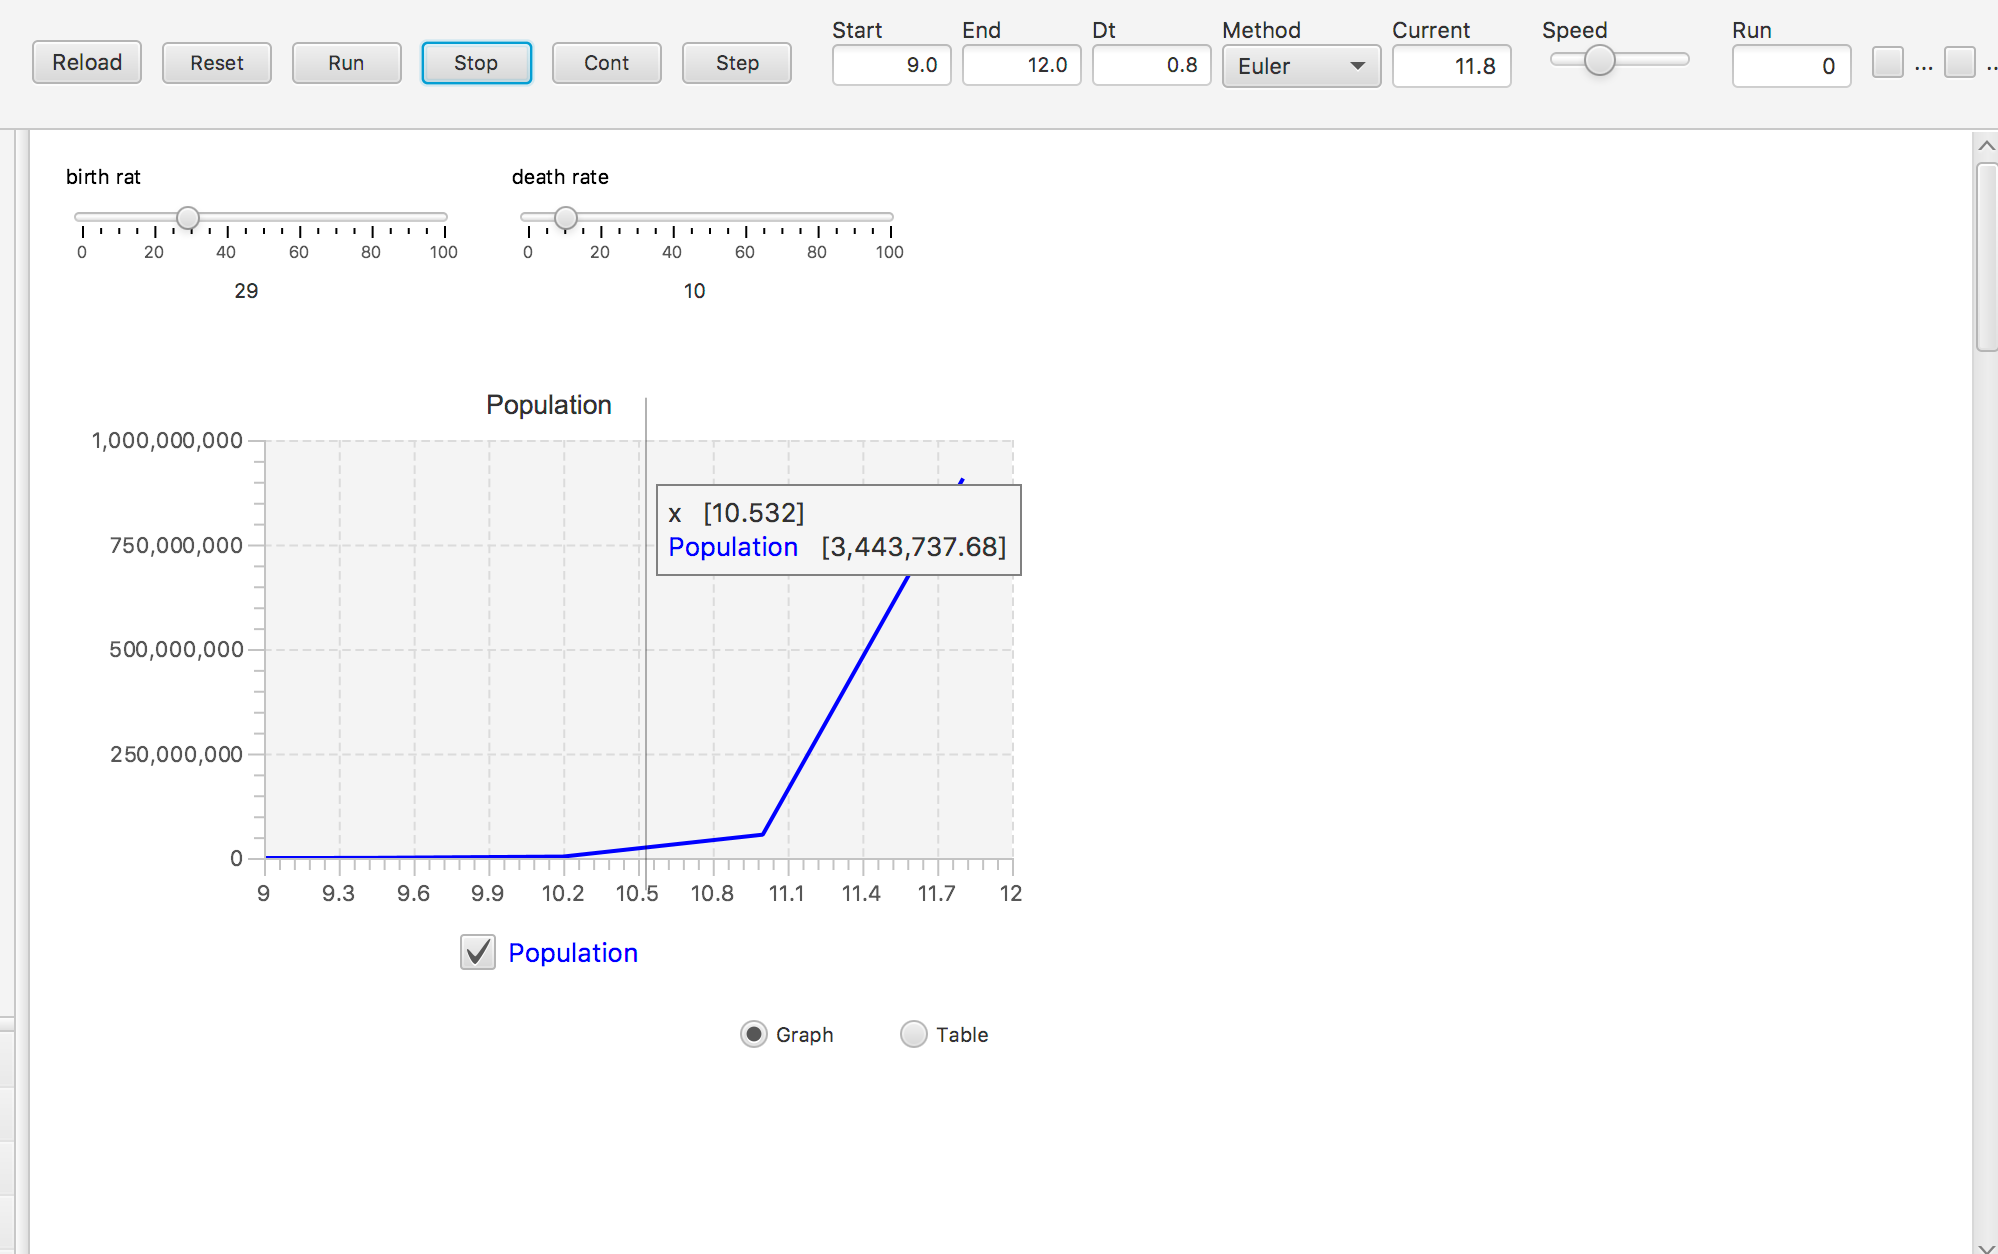
- Start and End indicate the time frame of data that you wish to observe. Euler is used as this dataset is continuous. Place your cursor on the blue line to observe the exact population at a given time.
- Congratulations on creating your first Numerus model - the Basic Population Model!