CENTRAL LIMIT THEOREM (GAUSSIAN) MODEL
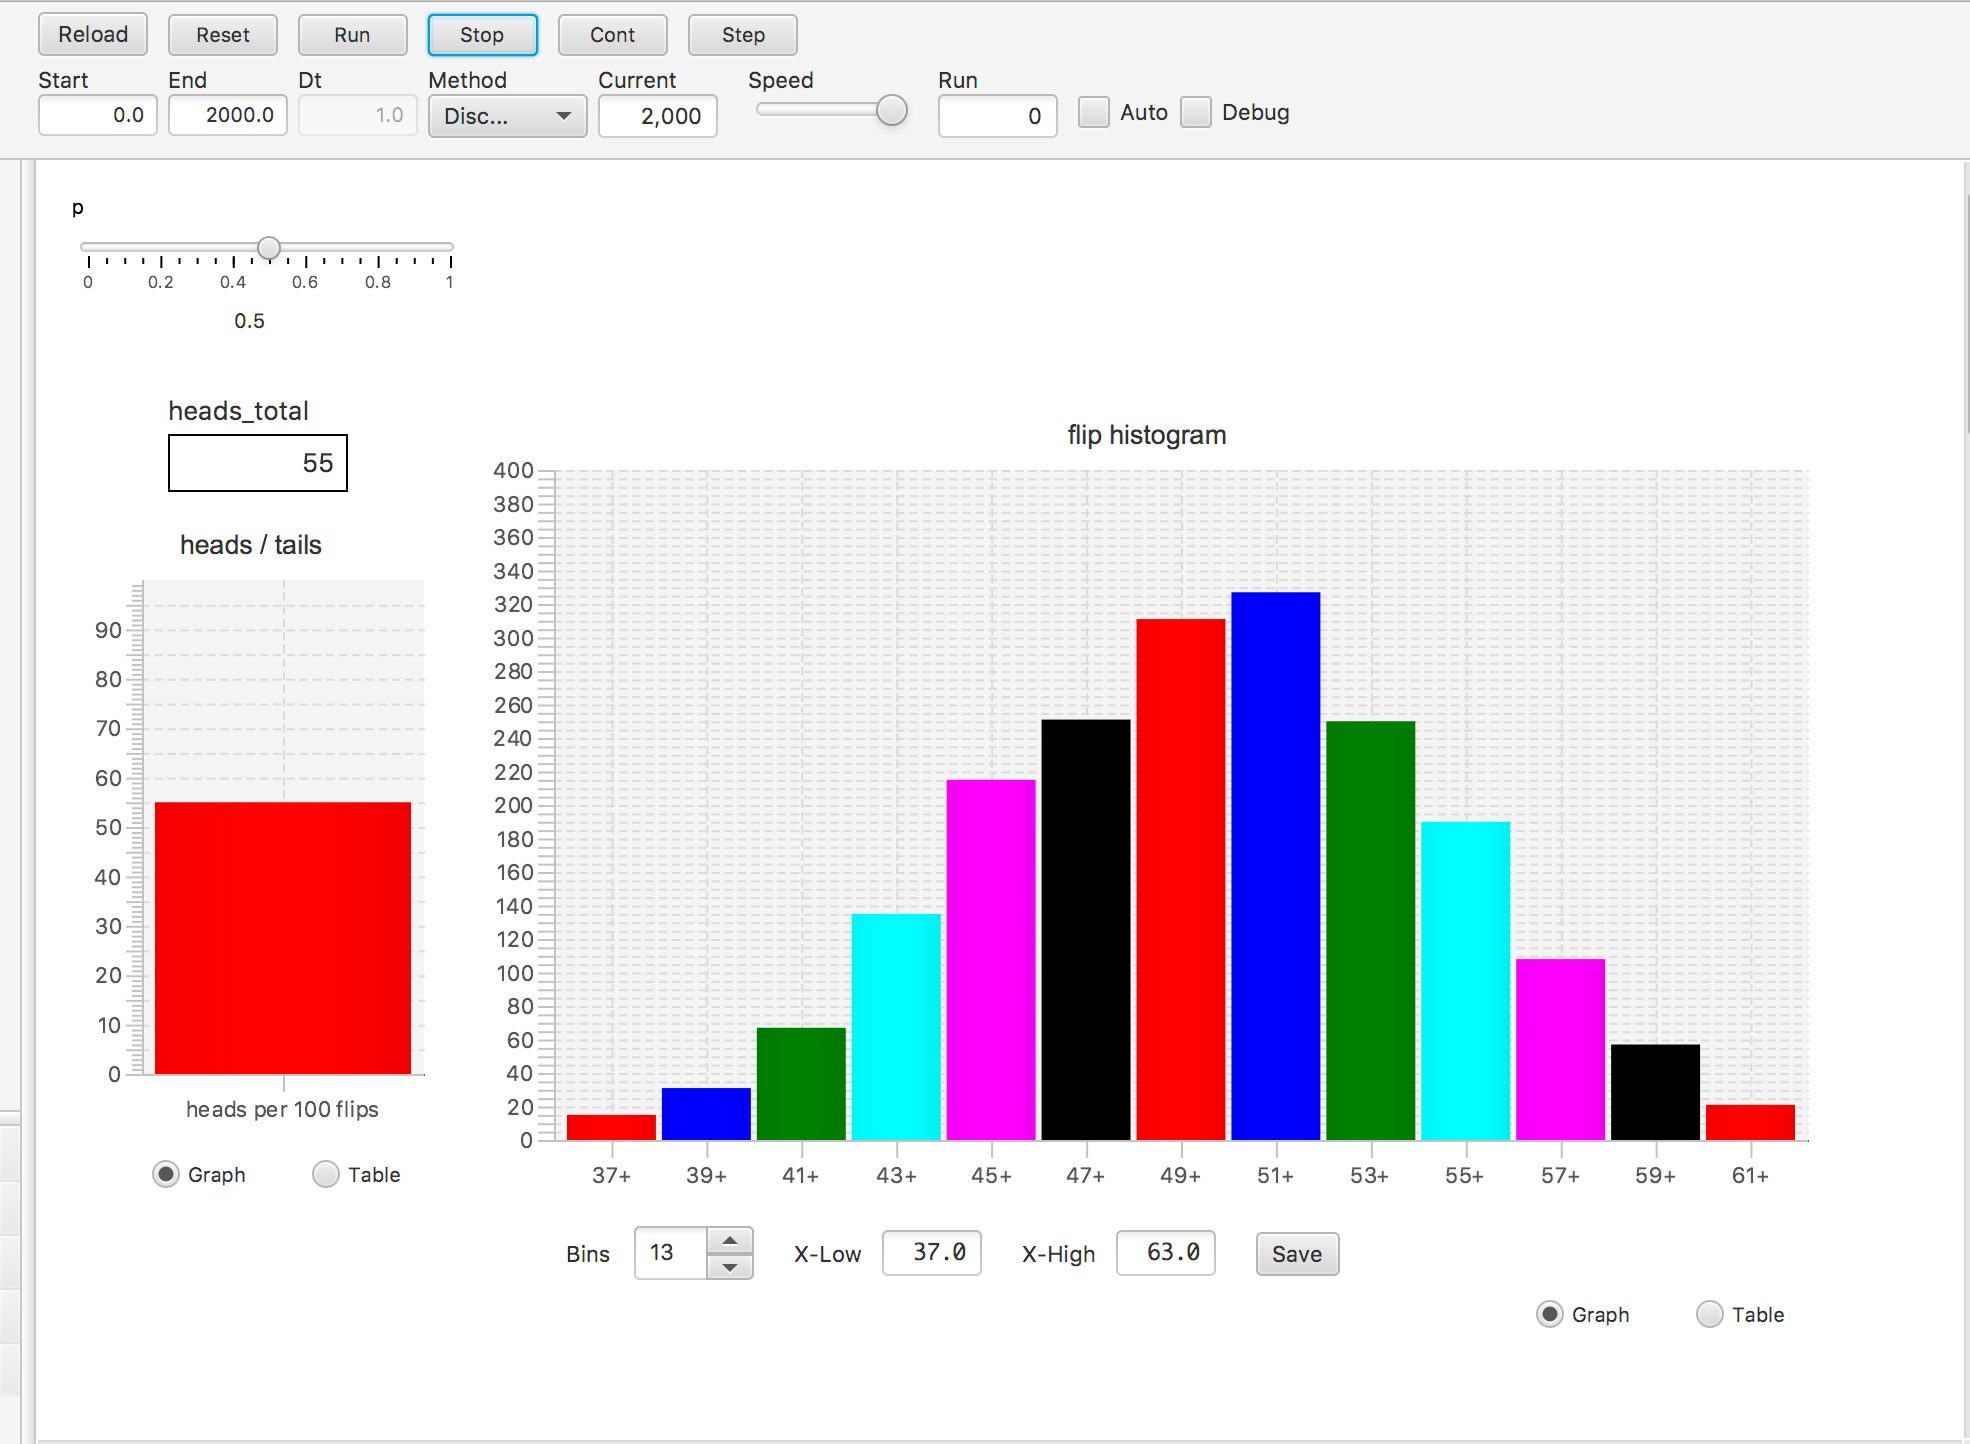
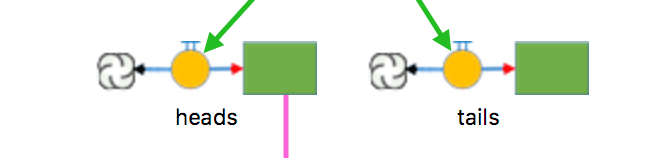
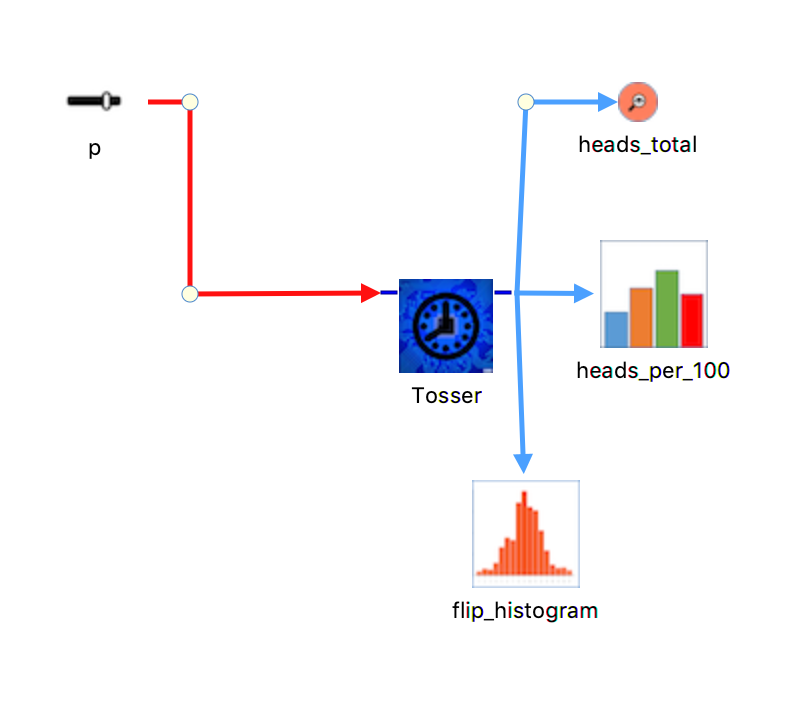
The stocks heads and tails accumulate flip totals. If you run 100 flips with a weight of .5, you will get a heads/tails total of around 50/50. Of course, the actual outcome cannot
be predicted. We now wish to repeat the 100-flip experiment 1000 times, and plot a histogram showing the total number of heads.
Clicking Load/Exec produces 1000 runs of the 100-flips; at the end of each 100-flip run the total number of heads is recorded in the histogram and displayed in the graph. With
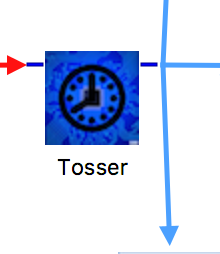
a fair coin, this histogram assumes a Gaussian shape. Tosser is a clocked chip designed to implement the 100-flip experiment. (A clocked chip runs a complete simulation (in
this case a 100-flip coin toss) for each time interval of the main simulation.)
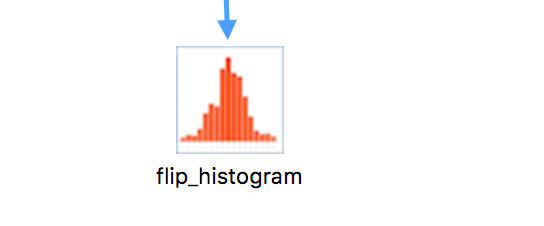
A Histogram display component shows the results. The heads_per_100 graph shows the number of heads per 100 flip experiment.
THE MODEL (Gaussian, Top Layer)
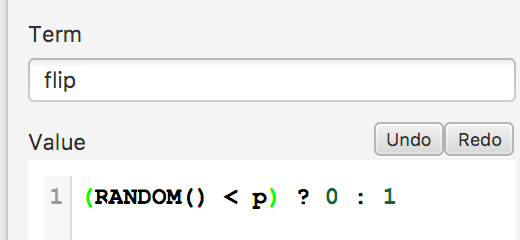
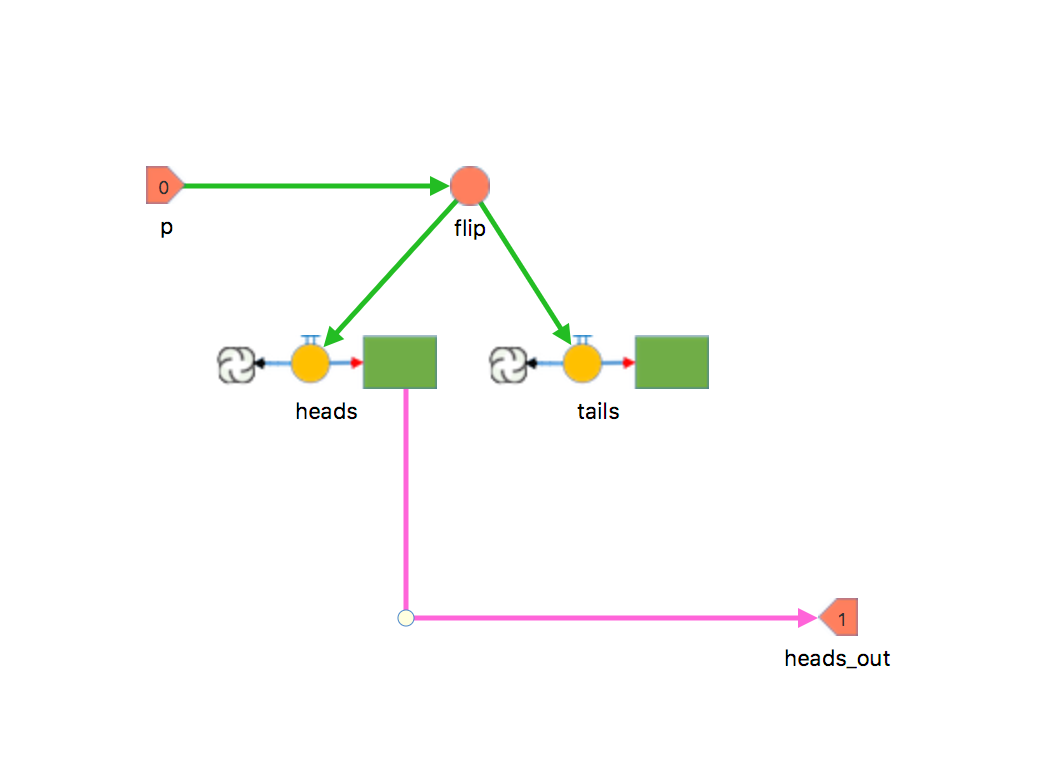
THE MODEL (Flip, Bottom Layer)
THE MODEL LAUNCH